There is no better feeling than having a well functioning website! I have spent the last week making entropicdomain as performant as possible, and I think I made great progress overall! I had to do multiple things for that which I can detail below.
The main problems I needed to trouble shoot were made apparent using “Lighthouse”, a performance measuring tool for websites which would let a user know pretty quickly what the problem was… on my end it was an array of issues, which all intersect with different areas like Search Engine Optimisation and Accessibility. Lighthouse is pretty easy to use, you just install it as a Chrome extension and then can use it over the Dev tools or click on the extension button so you can run a quick test in the browser. It then analyzes your page and spits out some useful results.
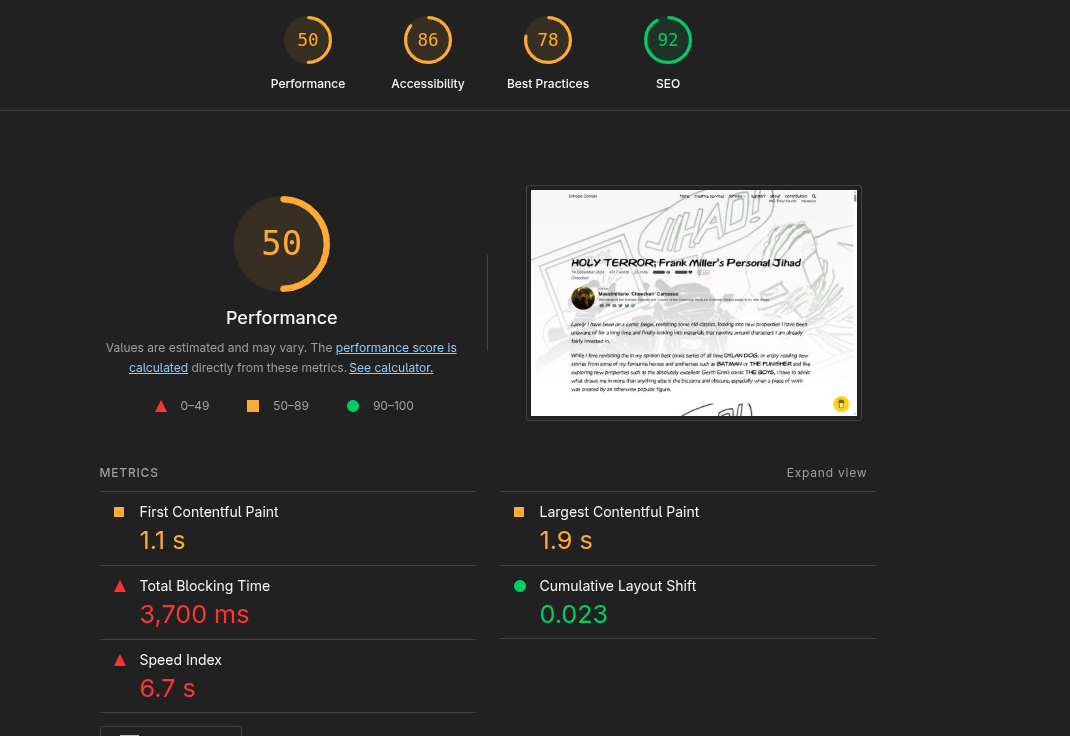 This is how a test looks like! It grades your Performance, Accessibility, Best Practices and SEO, which are all dependant on multiple factors and can all be improved in more or less intensive ways. The good thing is, the metrics on which Lighthouse grades your site are listed below, broken up into the…
- First Contentful Paint: meaning how long it takes for the first content element to be loaded (like an image for instance)
- Largest Contentful Paint: How long it takes for the biggest media to be loaded onto the page
- Total Blocking Time: A time during which the site is absolutely unresponsive due to JavaScript programs loading in, a deadly one for Crawlers and general usability, especially when a user clicks off the site if the loading time is just a second too long
- Cumulative Layout Shift: As far as I understand that one means how much the website’s graphical elements shift out of position
- Speed Index: The general speed rating of your site
This page I was testing, the Holy Terror article on there, was exceedingly heavy. While it is nowhere near as terrible in terms of image size as other articles are, it has a lot of special things going on. There is a special font, there is a bunch of YouTube embeds which all execute their own JavaScript, and at the time of making the test, the images on the article were horribly unoptimised. Let’s look at these issues in a more isolated context!
Images
Images are the most used resource on this website, and will likely continue to be for a long time. The biggest problem with images really is their size and LACK of compression. So one project here was to batch convert all PNG’s to WebP pictures. Through intense googling and trying different batch scripts from stack overflow, I managed to find the right encoder to use (google’s cwebp) and the right command to use too, which is the following:
for file in *.png; do if [ -f "$file" ]; then cwebp -m 6 -pass 10 -mt -q 70 $file -o "${file%.*}.webp" -quiet ; fi; done
So what this stolen code does, is that within the folder it is ran in, it transcodes PNGs into WebPs based on multiple options. -m and -pass control how slowly the encode goes, which should be the slowest for best compression and quality, so I put the values to “-m 6 -pass 10”. -mt specifies that the encode is multithreaded making the most out of your CPU. -q controls quality, for which a quality setting of 70 is a good mix of high compression and OK quality. The files are then written into the folder having identical names to before. The only thing left to do is going into the VS Code page, pressing CTRL + H for a batch replace, and then swap out .png with .webp. Presto, insane savings. To read more on that check out the NFO page “the HUGE tiny update!”
The only thing left to do is scrunching down the resolution of a bunch of images so that the site is even smaller. There are some absurd resolutions used on some featured images and all across articles, and that is honestly unacceptable from a performance standpoint as I learned.
JavaScript
The most insidious problem is JavaScript blocking time. What essentially happens is that all the JavaScript in the world wants to execute on the main CPU thread, which severely slows the site down. On my page multiple articles had a JavaScript blocking time of around 3 to even 8 seconds. What this means for the end user, who likely also has slower internet, may be on the phone or has some other technological disability, is that the blocking time is likely even longer for one but second (and this actually goes for everyone) would be that NOTHING on the site is actually clickable for that duration of time. This is a very serious problem, as most website visitors click off very quickly if they perceive the site to not be fully loaded in yet.
This could be an issue with search engine crawlers too, as JavaScript blocking time may lead to Google’s bots thinking that the site is inaccessible or something and opting to not look further into it, which of course is not good. Obviously.
In the end, I installed Partytown with the help of a Fireship demonstration and a Hugo tutorial. I then wrapped my firebase integration with Partytown and YouTube embed scripts were taken care of by the library too. NO MORE BLOCKING TIME.
Partytown: https://partytown.qwik.dev/
Implement Partytown into Hugo: https://jaydenm.com/blog/setup-partytown-in-hugo/
Fireship video on Partytown: https://www.youtube.com/watch?v=ZZIR1NGwy-s
Alt Text
In the next shameful chapter of “Apparently we didn’t want anyone to enjoy the site”: There was basically no alt text appended to most media on the site. That is unacceptable, not just for readers with visual impediments, but also for Search Engine Optimisation. Google doesn’t know what an image is without a description, so it will never really be able to serve such pictures in the future if it cant even read them. At least I believe that is how it works.
Minifying Text
Then I minified aaaaaall the text I could on my site. Or rather I thought I did, in actuality it wasn’t properly enabled, but now it is. Since I use HUGO Extended, that was actually insanely easy, as the framework already provides you with such tools. If you want to minify everything on your site, just copy the following text and slap that somewhere into your config.toml.
[minify]
  disableCSS = false
  disableHTML = false
  disableJS = false
  disableJSON = false
  disableSVG = false
  disableXML = false
  minifyOutput = true
You can alternatively also just build the site with the —minify flag.
This makes sure nothing is disabled, and basically every text file is gonna get squished down, which again improves load times by decreasing file size.
After all of this, page loads are finally quick. The site is actually lightweight (on some articles “lighter weight”) now. And maybe, this is the start of something much more exciting for the website. Here is a little lighthouse report of the same page I displayed before.


Would you look at that! We did multiple tests, in Incognito mode, out of Incognito mode, testing in a normal window with cache disabled, and one test was even done from my friend on a different computer, with results being generally very positive. So I can say…